Manage jobs
Submitting and managing jobs in the Cirrus HPC and HTC clusters
- Start here
- Queues information
- Manage slurm jobs
- Slurm
- Jobs information
- My first slurm job
- overview of the resources offered
- show job accounting data
- stop or cancel jobs
- Show jobs information in queue
- How to run parallel job's with srun
- Preparing the Environment
- Interactive Sessions
- Job pipeline using slurm dependencies
- Use of user QOS for CPU jobs
- GPU user guide
- Troubleshooting information
- UDocker Containers
- Monitoring
- Quality of Service (QOS)
Start here
Cluster specific information
CNCA provides acess to several HPC computing clusters. The policies, limits and characteristics of these HPC clusters can be different, always check where you are running and whether the manuals and/or instructions are the correct ones.
CNCA-Lisbon cluster
- This cluster uses the Slurm batch system. The documentation for the Slurm batch system is [click here]
CNCA-Vila Real cluster
- This cluster uses the Slurm batch system. The documentation for the Slurm batch system is [click here]
Queues information
List of Queues
INCD-Lisbon cluster (cirrus.a.incd.pt)
| Name | Jobs max elapsed time | access | Memory | Max #cores[1] | Comments |
|---|---|---|---|---|---|
| gpu | 72h | everyone | 2 GB/Core | 16 | queue for GPU resources |
| hpc | 72h | everyone | 8 GB/Core | 64 | default queue |
| fct | 72h | reserved (require use of QOS) | 8 GB/Core | 96 | queue for FCT grant users |
[1] Maximum number of cores a user can request
[2] Access based on evaluation and upon request
Manage slurm jobs
How to manage jobs using slurm the batch system in the Cirrus clusters.
Slurm
Slurm's architecture
Slurm is made of a slurmd daemon running on each compute node and a central slurmctld daemon running on a management node.
Node
In slurm a node is a compute resource, usually defined by particular consumable resources, i.e. cores, memory, etc…
Partitions
A partition (or queue) is a set of nodes with usually common characteristics and/or limits. Partitions group nodes into logical sets. Nodes are shareable between partitions.
Jobs
Jobs are allocations of consumable resources from the nodes and assigned to a user under the specified conditions.
Job Steps
A job step is a single task within a job. Each job can have multiple tasks (steps) even parallel ones.
Common user commands:
-
sacct: report job accounting information about running or completed jobs.
-
salloc: allocate resources for a job in real time. Typically used to allocate resources and spawn a shell. Then the shell is used to execute commands to launch parallel tasks.
-
sbatch: submit a job script for later execution. The script typically contains the tasks plus and the environment definitions needed to execute the job.
-
scancel: cancel a pending or running job or job step.
-
sinfo: overview of the resources (node and partitions).
-
squeue: used to report the state of running and pending jobs.
-
srun:submit a job for execution or initiate job steps in real time. The srun allows users to requests consumable resources.
Jobs information
List all current jobs for a user:
squeue -u <username>
List all running jobs for a user:
squeue -u <username> -t RUNNING
List all pending jobs for a user:
squeue -u <username> -t PENDING
List all current jobs in the shared partition for a user:
squeue -u <username> -p shared
List detailed information for a job (useful for troubleshooting):
scontrol show jobid -dd <jobid>
List status info for a currently running job:
sstat --format=AveCPU,AvePages,AveRSS,AveVMSize,JobID -j <jobid> --allsteps
Additional information for complet jobs (not available during the run):
sacct -j <jobid> --format=JobID,JobName,MaxRSS,Elapsed
To view information for all jobs of a user:
sacct -u <username> --format=JobID,JobName,MaxRSS,Elapsed
My first slurm job
Examples
Submit a simple MPI job
-
On this example we run a small MPI application doing the following steps:
- Create a submission file
- Submit the job to the default partition
- Execute a simple MPI code
- Check the status of the job
- Read the output
-
Download source code
wget --no-check-certificate https://wiki.incd.pt/attachments/71 -O cpi.c
- Create a submission file
vi my_first_slurm_job.sh
- Edit the file
#!/bin/bash

#SBATCH --job-name=MyFirstSlurmJob
#SBATCH --time=0:10:0
#SBATCH --nodes=1
#SBATCH --ntasks-per-node=16

# Be sure to request the correct partition to avoid the job to be held in the queue, furthermore
#	on CIRRUS-B (Minho)  choose for example HPC_4_Days
#	on CIRRUS-A (Lisbon) choose for example hpc
#SBATCH --partition=hpc

# Used to guarantee that the environment does not have any other loaded module
module purge

# Load software modules. Please check session software for the details
module load gcc63/openmpi/4.0.3

# Prepare
src='cpi.c'
exe="./cpi.$SLURM_JOB_ID"

# Compile application
echo "=== Compiling ==="
mpicc -o $exe $src

# Run application. Please note that the number of cores used by MPI are assigned in the SBATCH directives.
echo "=== Running ==="
if [ -e $exe ]; then
    chmod u+x $exe
    mpiexec -np $SLURM_NTASKS $exe
    rm -f $exe
fi

echo "Finished with job $SLURM_JOBID"
- Submit the job
sbatch my_first_slurm_job.sh
- Check status of the job
$ squeue

JOBID PARTITION     NAME     USER     ST       TIME      NODES NODELIST(REASON)
1171  HPC_4_Days    MyFirstS username PD       0:00      1     wn075
- Check further details about your job (very long output)
scontrol show job 1171
- Read the output of the job:
If name is not specified slurm will create by default a file with the output of your run
slurm-{job_id}.out
e.g. slurm-1171.out
- Cancel your job
$ scancel 1171
MPI examples:
Hellow World:
#include <mpi.h>
#include <stdio.h>

int main(int argc, char** argv) {
    // Initialize the MPI environment
    MPI_Init(NULL, NULL);

    // Get the number of processes
    int world_size;
    MPI_Comm_size(MPI_COMM_WORLD, &world_size);

    // Get the rank of the process
    int world_rank;
    MPI_Comm_rank(MPI_COMM_WORLD, &world_rank);

    // Get the name of the processor
    char processor_name[MPI_MAX_PROCESSOR_NAME];
    int name_len;
    MPI_Get_processor_name(processor_name, &name_len);

    // Print off a hello world message
    printf("Hello world from processor %s, rank %d out of %d processors\n",
    processor_name, world_rank, world_size);

    // Finalize the MPI environment.
    MPI_Finalize();
    }
PI calculation
/* -*- Mode: C; c-basic-offset:4 ; -*- */
/*
 *  (C) 2001 by Argonne National Laboratory.
 *      See COPYRIGHT in top-level directory.
 */

#include "mpi.h"
#include <stdio.h>
#include <math.h>

int main(int argc,char *argv[])
{
    long int    n, i;
    int    myid, numprocs;
    double PI25DT = 3.141592653589793238462643;
    double mypi, pi, h, sum, x;
    double startwtime = 0.0, endwtime;
    int    namelen;
    char   processor_name[MPI_MAX_PROCESSOR_NAME];

    MPI_Init(&argc,&argv);
    MPI_Comm_size(MPI_COMM_WORLD,&numprocs);
    MPI_Comm_rank(MPI_COMM_WORLD,&myid);
    MPI_Get_processor_name(processor_name,&namelen);

    n = 100000000000;		/* default # of rectangles */
    if (myid == 0) {
    	startwtime = MPI_Wtime();
	}

    MPI_Bcast(&n, 1, MPI_INT, 0, MPI_COMM_WORLD);

    h   = 1.0 / (double) n;
    sum = 0.0;

    /* A slightly better approach starts from large i and works back */
    for (i = myid + 1; i <= n; i += numprocs)
    {
	x = h * ((double)i - 0.5);
	sum += 4.0 / (1.0 + x*x);
    }
    mypi = h * sum;

    MPI_Reduce(&mypi, &pi, 1, MPI_DOUBLE, MPI_SUM, 0, MPI_COMM_WORLD);

    if (myid == 0) {
    	endwtime = MPI_Wtime();
    	printf("pi=%.16f, error=%.16f, ncores %d, wall clock time = %f\n", pi, fabs(pi - PI25DT), numprocs, endwtime-startwtime);
    	fflush(stdout);
    }

    MPI_Finalize();
    return 0;
}
overview of the resources offered
sinfo : overview of the resources offered by the cluster
By default, sinfo lists the available partitions name(s), availability, time limit, number of nodes, their state and the nodelist. A partition is a set of compute nodes.
The command sinfo by default
$ sinfo

PARTITION AVAIL  TIMELIMIT  NODES  STATE NODELIST
all*         up   infinite      5  down* wn[075,096,105,110,146]
all*         up   infinite      6  drain wn[077,091,101,117,143,148]
all*         up   infinite      2    mix wn[079,097]
all*         up   infinite     33  alloc wn[081-089,092-095,099-100,104,108,112,115,118,124,135-139,144-145,151,155-158]
all*         up   infinite     40   idle wn[071-073,076,080,090,098,102-103,106-107,109,111,113-114,116,120-123,125-128,130-134,140-142,147,149-150,152-154,159-160]
all*         up   infinite      4   down wn[074,078,119,129]
debug        up   infinite      8   idle wn[060-063,065-067,069]
debug        up   infinite      3   down wn[064,068,070]
The command sinfo --Node provides the list of nodes and their actual state individually.
$ sinfo -Node

NODELIST   NODES PARTITION STATE
wn071          1      all* alloc
wn072          1      all* drain
wn073          1      all* alloc
wn074          1      all* down
wn075          1      all* down*
wn076          1      all* alloc
The command sinfo --summarize provides the node state in the form "available/idle/other/total"
$ sinfo --summarize

PARTITION AVAIL  TIMELIMIT   NODES(A/I/O/T)  NODELIST
all*         up   infinite       36/7/47/90  wn[071-160]
debug        up   infinite         2/6/3/11  wn[060-070]
The command sinfo --long provides additional information than sinfo. Informations about the OverSubscribe (OVERSUBS), All the queues are defined as OVERSUBS=NO, none of the partitions(queues) allow requestes over the limit of the consumable resources.
$ sinfo --long

PARTITION AVAIL  TIMELIMIT   JOB_SIZE ROOT OVERSUBS     GROUPS  NODES       STATE NODELIST
all*         up   infinite 1-infinite   no       NO        all      5       down* wn[075,096,105,110,146]
all*         up   infinite 1-infinite   no       NO        all     38     drained wn[072-073,076-077,080,090-091,098,101-103,106-107,109,113-114,116-117,120-123,125-128,130,133-134,136,140-141,143,147-148,150,152,159]
all*         up   infinite 1-infinite   no       NO        all      4       mixed wn[079,094,097,137]
all*         up   infinite 1-infinite   no       NO        all     32   allocated wn[071,081-089,092-093,095,099-100,104,108,112,115,118,124,131-132,135,138-139,144,151,155-158]
all*         up   infinite 1-infinite   no       NO        all      7        idle wn[111,142,145,149,153-154,160]
With sinfo you can also filter the nodes/partitions for specific situation, in this example we requested to list the nodes either idle or down
$sinfo --states=idle,down

PARTITION AVAIL  TIMELIMIT  NODES  STATE NODELIST
all*         up   infinite      5  down* wn[075,096,105,110,146]
all*         up   infinite      8   idle wn[113,116,121-122,126,140-141,143]
all*         up   infinite      4   down wn[074,078,119,129]
debug        up   infinite      7   idle wn[060-063,065-067]
debug        up   infinite      3   down wn[064,068,070]
For more detailed information, please see manual
man sinfo
states:
- mix : consumable resources partially allocated
- idle : available to requests consumable resources
- drain : unavailable for use per system administrator request
- drng : currently executing a job, but will not be allocated to additional jobs. The node will be changed to state DRAINED when the last job on it completes
- alloc : consumable resources fully allocated
- down : unavailable for use. Slurm can automatically place nodes in this state if some failure occurs.
show job accounting data
sacct: displays accounting data for all jobs and job steps in the Slurm job accounting log or Slurm database
If you use the command without any paremeters it will show you the currently running jobs accounting data.
$ sacct

       JobID    JobName  Partition    Account  AllocCPUS      State ExitCode
------------ ---------- ---------- ---------- ---------- ---------- --------
1127         omp-bkp-o+      debug       incd         16    RUNNING      0:0
1128         omp-bkp-o+      debug       incd         16    RUNNING      0:0
1128.0            a.out                  incd         16    RUNNING      0:0
1129         omp-bkp-o+      debug       incd         16    RUNNING      0:0
1129.0            a.out                  incd         16    RUNNING      0:0
1130         omp-bkp-o+      debug       incd         16    RUNNING      0:0
1156         run_zacar+ HPC_4_Days       root          1    RUNNING      0:0
You can specify the job which data you would like to view by using the -j flag.
$ sacct -j 1156

JobID    JobName  Partition    Account  AllocCPUS      State ExitCode
------------ ---------- ---------- ---------- ---------- ---------- --------
1156         run_zacar+ HPC_4_Days       root          1    RUNNING      0:0
You can list jobs by user, by adding the -u flag and choosing the user.
$ sacct -u jprmachado

       JobID    JobName  Partition    Account  AllocCPUS      State ExitCode
------------ ---------- ---------- ---------- ---------- ---------- --------
1127         omp-bkp-o+      debug       incd         16    RUNNING      0:0
1128         omp-bkp-o+      debug       incd         16    RUNNING      0:0
1128.0            a.out                  incd         16    RUNNING      0:0
1129         omp-bkp-o+      debug       incd         16    RUNNING      0:0
1129.0            a.out                  incd         16    RUNNING      0:0
1130         omp-bkp-o+      debug       incd         16    RUNNING      0:0
You can also filter or create your own custom reports by using the --format flag and choosing what data to show.
$ sacct --format=User,JobID,Jobname,partition,state,time,start,end,elapsed,MaxRss,MaxVMSize,nnodes,ncpus,nodelist

     User        JobID    JobName  Partition      State  Timelimit               Start                 End    Elapsed     MaxRSS  MaxVMSize   NNodes      NCPUS        NodeList
--------- ------------ ---------- ---------- ---------- ---------- ------------------- ------------------- ---------- ---------- ---------- -------- ---------- ---------------
jprmacha+ 1127         omp-bkp-o+      debug    RUNNING 20-20:00:+ 2019-11-20T11:44:28             Unknown 9-04:00:00                              1         16           wn018
jprmacha+ 1128         omp-bkp-o+      debug    RUNNING 20-20:00:+ 2019-11-20T11:46:43             Unknown 9-03:57:45                              1         16           wn019
          1128.0            a.out               RUNNING            2019-11-20T11:46:43             Unknown 9-03:57:45                              1         16           wn019
jprmacha+ 1129         omp-bkp-o+      debug    RUNNING 20-20:00:+ 2019-11-20T11:51:30             Unknown 9-03:52:58                              1         16           wn020
          1129.0            a.out               RUNNING            2019-11-20T11:51:31             Unknown 9-03:52:57                              1         16           wn020
jprmacha+ 1130         omp-bkp-o+      debug    RUNNING 20-20:00:+ 2019-11-20T11:52:37             Unknown 9-03:51:51                              1         16           wn012
     root 1156         run_zacar+ HPC_4_Days    RUNNING 8-00:00:00 2019-11-27T13:40:02             Unknown 2-02:04:26                              1          1           wn035
There is also the possibility to filter you custom report by user and date, you just have to add the -u and --start flags.
$ sacct --format=User,JobID,Jobname,partition,state,time,start,end,elapsed,MaxRss,MaxVMSize,nnodes,ncpus,nodelist -u zbenta --start 2019-11-28

     User        JobID    JobName  Partition      State  Timelimit               Start                 End    Elapsed     MaxRSS  MaxVMSize   NNodes      NCPUS        NodeList
--------- ------------ ---------- ---------- ---------- ---------- ------------------- ------------------- ---------- ---------- ---------- -------- ---------- ---------------
   zbenta 1163           clover32     stage2    TIMEOUT   04:00:00 2019-11-28T13:22:31 2019-11-28T17:22:46   04:00:15                              8        128     wn[022-029]
          1163.batch        batch             CANCELLED            2019-11-28T13:22:31 2019-11-28T17:22:47   04:00:16     40152K    186176K        1         16           wn022
          1163.0            orted                FAILED            2019-11-28T13:22:35 2019-11-28T17:22:46   04:00:11     38104K    254748K        7          7     wn[023-029]
You can also use the flags to give you a report during a specific time interval, just use the --start and --end flags.
$ sacct --format=User,JobID,Jobname,partition,state,time,start,end,elapsed,MaxRss,MaxVMSize,nnodes,ncpus,nodelist -u zbenta --start 2019-10-07 --end 2019-10-11

     User        JobID    JobName  Partition      State  Timelimit               Start                 End    Elapsed     MaxRSS  MaxVMSize   NNodes      NCPUS        NodeList
--------- ------------ ---------- ---------- ---------- ---------- ------------------- ------------------- ---------- ---------- ---------- -------- ---------- ---------------
   zbenta 15            Run_PRISM      debug     FAILED 365-00:00+ 2019-10-07T11:05:58 2019-10-07T11:06:09   00:00:11                              2         32     wn[018-019]
          15.batch          batch                FAILED            2019-10-07T11:05:58 2019-10-07T11:06:09   00:00:11                              1         16           wn018
          15.0              orted             COMPLETED            2019-10-07T11:06:02 2019-10-07T11:06:07   00:00:05                              1          1           wn019
   zbenta 20            Run_PRISM      debug CANCELLED+  UNLIMITED 2019-10-08T11:42:01 2019-10-08T12:12:03   00:30:02                              2         32     wn[018-019]
          20.batch          batch             CANCELLED            2019-10-08T11:42:01 2019-10-08T12:12:05   00:30:04   2626556K    186140K        1         16           wn018
          20.0              orted                FAILED            2019-10-08T11:42:05 2019-10-08T12:12:08   00:30:03   2594880K    292116K        1          1           wn019
   zbenta 28            Run_PRISM      debug     FAILED  UNLIMITED 2019-10-11T14:33:06 2019-10-11T14:33:06   00:00:00                              2         32     wn[003,015]
          28.batch          batch                FAILED            2019-10-11T14:33:06 2019-10-11T14:33:06   00:00:00                              1         16           wn003
**For more detailed information, please see the manual
man sacct**
stop or cancel jobs
scancel : used to signal jobs or job steps that are under the control of Slurm
The command scancel is used to signal or cancel jobs, job arrays or job steps . A job or job step can only be signaled by the owner of that job or user root. If an attempt is made by an unauthorized user to signal a job or job step, an error message will be printed and the job will not be signaled.
$ scancel <jobid>


JOBID PARTITION     NAME     USER ST       TIME  NODES NODELIST(REASON)
33416       all Hexadeca    fcruz  R    3:26:11      2 wn[131-132]
33434     debug  OFBuild  lmendes  R    1:50:42      1 wn069
33437       all       FE ngalamba  R      58:07      1 wn094
33439       all       FE ngalamba  R      29:43      1 wn097
33440       all       FE ngalamba  R      29:13      1 wn137
33441       all       FE ngalamba  R      13:43      1 wn126
33442       all       FE ngalamba  R       1:58      1 wn071
33443       all       FE ngalamba  R       1:41      1 wn071
33445       all       FE ngalamba  R       0:12      1 wn079
You can all your jobs (running and pending)
$ scancel --user <username>
You may also only cancel all your jobs in a specific element, i.e. state, partition...
$ scancel --state PENDING --user <username>
$ Job can be also canceled using the job name
$ scancel --name <jobname>
For more detailed information, please see
man scancel
Show jobs information in queue
squeue: view information about jobs located in the Slurm scheduling queue.
gqueue: squeue alias formated to show specific jobs information
general usage
If you use the command without any paremeters it will show you the currently running jobs in the queue.
$ squeue

JOBID PARTITION     NAME     USER ST       TIME  NODES NODELIST(REASON)
1127     debug omp-bkp- jprmacha  R 9-04:38:00      1 wn018
1128     debug omp-bkp- jprmacha  R 9-04:35:45      1 wn019
1129     debug omp-bkp- jprmacha  R 9-04:30:58      1 wn020
1130     debug omp-bkp- jprmacha  R 9-04:29:51      1 wn012
1156 HPC_4_Day run_zaca     root  R 2-02:42:26      1 wn035
view jobs from a specific user
You can filter by user, using the --user flag
$ squeue --user root

JOBID PARTITION     NAME     USER ST       TIME  NODES NODELIST(REASON)
1156 HPC_4_Day run_zaca     root  R 2-02:44:28      1 wn035
view particular jobs
You can slso filter by job id, using the -j flag.
$ squeue -j 1127

JOBID PARTITION     NAME     USER ST       TIME  NODES NODELIST(REASON)
1127     debug omp-bkp- jprmacha  R 9-04:41:26      1 wn018
it is possible to provide multiple job id's separated by comma.
format the command output
The user may provide the output fields with format option "-O", for example showing the number of requested cpus:
$ squeue -o "%.7i %.9P %.8j %.8u %.2t %.10M %.6D %C %N" -u jmartins
JOBID PARTITION     NAME     USER ST       TIME  NODES CPUS NODELIST
192427    debug   cpi.sh jmartins  R       0:06      1   64 hpc047
gqueue alias
The user interfaces have an alias for the squeue comand called gqueue with some useful fields
$ gqueue
JOBID  PARTITION NAME    USER    ST TIME     NODES CPUS TRES_PER_NODE  NODELIST
184472 gpu       gpu-job gpuuser R  18:34:54 1     1    gpu            hpc058
**For more detailed information, please see the manual
man squeue**
How to run parallel job's with srun
srun : Used to submit/initiate job or job step
Typically, srun is invoked from a SLURM job script but alternatively, srun can be run directly from the command, in which case srun will first create a resource allocation for running the parallel job (the salloc is implicit)
srun -N 1 -c 16 -p HPC_4_Days --time=1:00:00 --pty /bin/bash
This command will request 16 cores (-c) of one Node (-N) for 1h00 in the partition (-p) HPC_4_Days. Please note that this is subject to Nodes availability, if no Nodes are available your request will be put in the queue waiting for resources.
The srun may also be executed inside a shell script.
#!/bin/bash

#SBATCH -N 3
#SBATCH -p HPC_4_Days

echo Starting job $SLURM_JOB_ID
echo SLURM assigned me these nodes
srun -l hostname
This batch job will result in the following output:
Starting job 51057
SLURM assigned me these nodes
0: wn054.a.acnca.pt
1: wn055.a.acnca.pt
2: wn057.a.acnca.pt
The 3 allocated nodes are released after the srun finish.
By default srun will use the pmi2, but you may consult the full list of the available mpi types.
$ srun --mpi=list

srun: MPI types are...
srun: pmi2
srun: openmpi
srun: none
To use a different mpi type e.g. srun --mpi=openmpi
For more detailed information, please see man srun
Preparing the Environment
There are lots of litte tweaks we need in order to prepate the environment for running specific software. We will try to describe the ones we use more regularly so it is easier for the users to work with them.
mvapich
Version 2.3.3 compiled wiht Intel 2020
module load intel/mvapich2/2.3.3
source $I_MPI_ROOT/intel64/bin/mpivars.sh intel64 -ofi_internal=0
export LD_PRELOAD="libmpi.so"
mpich
Version 3.2.2 compiled with Intel 2020
module load intel/mpich/3.3.2
export LD_PRELOAD="libmpi.so"
OpenMPI 4.0.3
Version 4.0.3 compiled with Intel 2019
module load intel/openmpi/4.0.3
export I_MPI_PMI_LIBRARY=/lib64/libpmi.so
openfoam
Version 1912 compiled wiht Intel 2020
module load intel/openfoami20/1912
source /cvmfs/sw.el7/ar/ix_es2680/i20/openfoami20/1912/build01/OpenFOAM-v1912/etc/bashrc
. /cvmfs/sw.el7/ar/ix_es2680/i20/openfoami20/1912/build01/OpenFOAM-v1912/bin/tools/RunFunctions
Version 1906 compiled wiht Intel 2020
module load intel/openfoami20/1906
source /cvmfs/sw.el7/ar/ix_es2680/i20/openfoami20/1906/build01/OpenFOAM-v1912/etc/bashrc
. /cvmfs/sw.el7/ar/ix_es2680/i20/openfoami20/1906/build01/OpenFOAM-v1912/bin/tools/RunFunctions
gromacs
intel/gromacs/2020.2
module load gcc-6.3
source /cvmfs/sw.el7/ar/ix_es2680/i20/gromacs/2020.2/build01/bin/GMXRC.bash
source /cvmfs/sw.el7/intel/2020/bin/compilervars.sh intel64
module load intel/gromacs/2020.2
intel/gromacs/2020.20-i20
module load gcc-7.5
source /cvmfs/sw.el7/ar/ix_es2680/i20/gromacs/2020.2/build02/bin/GMXRC.bash#source /cvmfs/sw.el7/intel/2020/bin/compilervars.sh intel64
source /cvmfs/sw.el7/intel/2020/bin/compilervars.sh intel64
module load intel/gromacs/2020.2
gromacs-4.6.7
module load gromacs-4.6.7
module load gcc63/openmpi/4.0.3
export GMX_MAXBACKUP=-1
mpirun -np 10 mdrun -s  benchMEM.tpr -nsteps 500000 -maxh 3.0 -resethway
Version 2020.2 compiled wiht Intel 2020
module load gcc-6.3
source /cvmfs/sw.el7/ar/ix_es2680/i20/gromacs/2020.2/build02/bin/GMXRC.bash
source /cvmfs/sw.el7/intel/2020/bin/compilervars.sh intel64
module load intel/gromacs/2020.2
Interactive Sessions
Slurm allow interactive sessions into the workernodes, using ssh, but within a valid job allocation, normal ssh are disabled. The interactive session can be created on the scope of normal partitions but those jobs will have the same priority as a regular job.
There is a limitation of 1 job and 1 task per node on partitions hpc and gpu, we would like to encourage users to close sessions as soon as possible to give all a good chance to use the resources.
The FCT grant users should use the partition fct instead in the examples bellow.
Starting srun Session
The most simple way to start an interactive session is:
[user@cirrus01 ~]$ srun -p hpc --job-name "my_interactive" --pty bash -i
srun: job 72791 queued and waiting for resources
srun: job 72791 has been allocated resources
[user@hpc059 ~]$
You will have an ssh session on a worker node were other users are running jobs or interactive sessions as well, try not bother them with unsolicitated interactions, and exit the session when you are finished.
The FCT call users should target the partition fct and the QOS associate to the user, e.g. "srun -p fct -q cpcaXXXX2020 ...", where XXXX is the call ID.
The srun command have the same restrictions as a normal job and will be aborted or refused to run when the system limits are axceeded. If you run the squeue you will see your interactive job listed as any other job:
[user@hpc059 ~]$ squeue
JOBID PARTITION     NAME     USER ST       TIME  NODES NODELIST(REASON)
72818       hpc my_inter     user  R       2:03      1 hpc059
Starting salloc Session
The salloc is setup to behave like the srun command, for example:
[user@cirrus01 ~]$ salloc -p hpc --job-name "my_interactive"
salloc: Pending job allocation 72818
salloc: job 72818 queued and waiting for resources
salloc: job 72818 has been allocated resources
salloc: Granted job allocation 72818
salloc: Waiting for resource configuration
salloc: Nodes hpc059 are ready for job
[user@hpc059 ~]$
Once again the FCT call users should target the partition fct and the QOS associate to the user
Job pipeline using slurm dependencies
Some times we need to launch a list of jobs that execute in sequence, one after another. In those cases we will use the --depency sbatch option, check the manual page for more details, we will only present a simple example.
Simple example
Suppose we need to submit the script my_first_job.sh and then mu_second_job.sh that should run after the first one:
[user@cirrus01 ~]$ sbatch my_first_job.sh
Submitted batch job 1843928

[user@cirrus01 ~]$ sbatch --dependency=after:1843928 my_second_job.sh
Submitted batch job 1843921

[user@cirrus01 ~]$ squeue
JOBID   PARTITION              NAME USER ST TIME NODES NODELIST(REASON)
1843928       hpc   my_first_job.sh user  R 0:11     1 hpc046
1843921       hpc  my_second_job.sh user PD 0:00     1 hpc047
In this case the second job will run even if the first job fails for some reason. The pending job will execute when the first finish his execution.
Tipical example
On a real case we may need the ensure that a good termination of the first job, for example, the first job may produce some output file needed as input for the second job:
[user@cirrus01 ~]$ sbatch my_first_job.sh
Submitted batch job 1843922

[user@cirrus01 ~]$ sbatch --dependency=afterok:1843922 my_second_job.sh
Submitted batch job 1843923
The afterok parameter states that the second job would start only if the previous job terminate with no errors.
Complex cases
Check the sbatch manual page for more details:
[user@cirrus01 ~]$ man sbatch
search for the -d, --dependency=<dependency_list> options explanation.
Use of user QOS for CPU jobs
In order to use QOS you will to have an assigned user QOS. In the following example the user will submit a job to the fct partition using an specific created cpca097822021.
#!/bin/bash
#SBATCH --job-name=prod01
#SBATCH --time=0:10:0
#SBATCH --partition=fct
#SBATCH --qos=cpca097822021
#SBATCH --output=%x.o%j
#SBATCH --error=%x.o%j
#SBATCH --nodes=1
#SBATCH --ntasks-per-node=16

### Prepare the environment
module purge
module load gcc83/openmpi/4.1.1 cuda-11.2

echo hostname
Not all queues allow QOS please follow guidance provided by the CNCA team when assigning the QOS.
GPU user guide
How to Run a Job with a GPU
Let's run the gravitational N-body simulation found on the CUDA toolkit samples on a GPU. This example is suited for a standard Cirrus user elegible to use the hpc and gpu partitions.
The fct partition and included resources is meant for users with a FCT grant and although the request of GPUs is made on the same way, they have specific instructions to follow found at FCT Calls
The GPU's are only available at the CIRRUS-A infrastruture in Lisbon.
Login on the user interface cirrus.a.acnca.pt
$ ssh -l user cirrus.a.acnca.pt
[user@cirrus01 ~]$ _
Prepare your working directory
Prepare your environment on a specific directory in order to protect from inter job interferences and create a submission batch script: *** only works for Cuda 10.2
[user@cirrus01 ~]$ mkdir myworkdir
[user@cirrus01 ~]$ cd myworkdir
[user@cirrus01 ~]$ cat nbody.sh
#!/bin/bash

#SBATCH --partition=gpu
#SBATCH --gres=gpu
#SBATCH --mem=8192MB

COMMON=/usr/local/cuda/samples/common
SAMPLE=/usr/local/cuda/samples/5_Simulations/nbody

[ -d ../common ] || cp -r $COMMON ..
[ -d nbody     ] || cp -r $SAMPLE .

module load cuda
cd nbody
make clean
make

if [ -e nbody ]; then
	chmod u+x nbody
	./nbody -benchmark -numbodies=2560000
fi
In this example we copy the n-body CUDA toolkit sample simulation to the working directory, load cuda environment, build the simulation and run it.
Requesting the partition
Standard Cirrus users at CIRRUS-A have access to the gpu partition providing NVIDIA Tesla-T4 GPUs. In order to access these GPUs request the gpu partition with directive:
#SBATCH --partition=gpu
The partition fct provide several types of NVIDIA: T4 and V100S (please check current resources available page). As a general rule and depending on the application, the types of GPUs available on the cluster are similar but the Tesla-V100S perform the same work in half the time when compared with the Tesla-T4. Nevertheless, if you request a Tesla-V100S you may have to wait for resource availability until you have a free Tesla-T4 ready to go.
If you only want a free GPU allocated for your job then the #SBATCH --grep=gpu* form would be the best choice.
Requesting the Tesla-T4 GPU
We request the allocation of one GPU NVIDIA Tesla-T4 throught the option:
#SBATCH --gres=gpu:t4
Standard Cirrus users can access only NVIDIA Tesla-T4 GPUs, so we can simplify the request:
#SBATCH --gres=gpu
this way we ask for a GPU of any type, the same is valid on partitions with more than one type of GPU if we do not care about the type of allocated GPU to our job.
Requesting memory
Ensure enough memory for your simulation, follow the tips on Determining Memory Requirements(page_to_be) page.
On our example 8GB is sufficient to run the simulation:
#SBATCH --mem=8192M
Submit the simulation
[user@cirrus01 ~]$ sbatch nbody.sh
Submitted batch job 1176
Monitor your job
You can use the squeue command line tool
[user@cirrus01 ~]$ gqueue
JOBID PARTITION NAME      USER     ST STATIME       NODES CPUS TRES_PER_NODE NODELIST
1176  gpu       nbody.sh  user5    R  RUN0-00:02:33 1     1    gpu:t4        hpc058
or use the command sacct, the job is completed when the State field mark is COMPLETED.
[user@cirrus01 ~]$ gacct
   JobID    JobName  Partition    Account  AllocCPUS      ReqGRES    AllocGRES      State ExitCode
------------ ---------- ---------- ---------- ---------- ------------ ------------ ---------- --------
1170       nbody.sh        fct        hpc          2  gpu:v100s:1        gpu:1  COMPLETED      0:0
1171       nbody.sh        fct        hpc          2     gpu:t4:1        gpu:1  COMPLETED      0:0
1175       teste.sh        fct        hpc          1                            COMPLETED      0:0
1176       nbody.sh        gpu        hpc          1        gpu:1        gpu:1  COMPLETED      0:0
if the state is different from COMPLETED or RUNNING then check your simulation or request help throught the email address helpdesk@acnca.pt providing the JOBID, the submission script, the relevant slurm output files, e.g. slurm-1176.out, or other remarks you think it may be helpfull
Check the results at job completion
[user@cirrus01 ~]$ ls -l
-rw-r-----+ 1 user hpc  268 Oct 22 13:56 gpu.sh
drwxr-x---+ 3 user hpc 4096 Oct 20 18:09 nbody
-rw-r-----+ 1 user hpc  611 Oct 22 13:41 slurm-1176.out


[user@cirrus01 ~]$ cat slurm-1176.out
...
> Windowed mode
> Simulation data stored in video memory
> Single precision floating point simulation
> 1 Devices used for simulation
GPU Device 0: "Turing" with compute capability 7.5

> Compute 7.5 CUDA device: [Tesla T4]
number of bodies = 2560000
2560000 bodies, total time for 10 iterations: 308586.156 ms
= 212.375 billion interactions per second
= 4247.501 single-precision GFLOP/s at 20 flops per interaction
Use QOS to run GPU jobs
- This page it's dedicate to users who want to run GPU's and have a QOS.
GPU JOB submission using QOS
- In this example we will use the atributed QOS=gpu097822021 to be used for GPU and submit a job for the V100 Nvidia.
#!/bin/bash
#SBATCH --job-name=prod01
#SBATCH --partition=gpu
#SBATCH --qos=gpu097822021
#SBATCH --gres=gpu:v100s
#SBATCH --output=%x.o%j
#SBATCH --error=%x.o%j

### Prepare the environment
module purge
module load gcc83/openmpi/4.1.1 cuda-11.2

echo $(hostname)
Deep Learning Example
The Cirrus-A facility provides several GPUs, check the Compute Node Specs page.
Login on the submit node
Login on the Cirrus cluster submition node, check the How to Access page for more information:
$ ssh -l <username> cirrus.a.acnca.pt
[username@cirrus01 ~]$ _
Alternatives to run the Deep Learning example
We have alternatives to run the Deep Learning example, or any other python based script:
- prepare a user python virtual environment on home directory and launch a batch job;
The next three sections shows how to run the example for each method.
1) Run a Deep Learning job using a prepared CVMFS python virtual environment
Instead of preparing an user python virtual environment we can use the environment already available on the system, named python/3.10.13, check it with the command
[username@cirrus08 ~]$ module avail
---------------- /cvmfs/sw.el8/modules/hpc/main ------------------
...
intel/oneapi/2023    python/3.8          udocker/alphafold/2.3.2
julia/1.6.7          python/3.10.13 (D)
...
We will find other python version, namely version 3.7 and 3.8, this version do not contain the tensorflo module due to python version incompatibility.
We will change the submit script dl.sh to the following:
[username@cirrus08 dl]$ vi dl.sh
#!/bin/bash
#SBATCH -p gpu
#SBATCH --gres=gpu
#SBATCH --mem=64G

module load python/3.10.7
python run.py

[username@cirrus08 dl]$ ls -l
-rwxr-----+ 1 username usergroup   124 Feb 26 16:44 dl.sh
-rw-r-----+ 1 username usergroup  1417 Feb 26 16:46 run.py
Submit the Job
[username@cirrus08 dl]$ sbatch dl.sh
Submitted batch job 15135448
JOBID    PARTITION NAME       USER        ST TIME       NODES CPUS TRES_PER_NODE  NODELIST
15290034 gpu       dl.sh      jpina       PD 0:00       1     1    gres/gpu
Check Job results
On completion check results on standard output and error files:
[username@cirrus08 dl]$ ls -l
-rwxr-----+ 1 username usergroup   124 Feb 26 16:44 dl.sh
-rw-r-----+ 1 username usergroup  1417 Feb 26 16:46 run.py
-rw-r-----+ 1 username usergroup 18000 Feb 26 18:51 slurm-15135448.out
and procceed as in the previous example.
How to selected a GPU
Select any GPU
- On this example we choose one GPU with at least 8192 MB memory.
#!/bin/bash

#SBATCH --partition=gpu
#SBATCH --gres=gpu
#SBATCH --mem=8192MB

COMMON=/usr/local/cuda/samples/common
SAMPLE=/usr/local/cuda/samples/5_Simulations/nbody

[ -d ../common ] || cp -r $COMMON ..
[ -d nbody     ] || cp -r $SAMPLE .

module load cuda
cd nbody
make clean
make

if [ -e nbody ]; then
	chmod u+x nbody
	./nbody -benchmark -numbodies=2560000
fi
Select a specific GPU: V100s
#!/bin/bash

#SBATCH --partition=gpu
#SBATCH --gres=gpu:v100s

COMMON=/usr/local/cuda/samples/common
SAMPLE=/usr/local/cuda/samples/5_Simulations/nbody

[ -d ../common ] || cp -r $COMMON ..
[ -d nbody     ] || cp -r $SAMPLE .

module load cuda
cd nbody
make clean
make

if [ -e nbody ]; then
	chmod u+x nbody
	./nbody -benchmark -numbodies=2560000
fi
GPU list
You can find the full GPU list per cluster here
Troubleshooting information
My jobs need to run longer than the queues permit
-
At Cirrus the default max elapsed time for the queues is 72h. The values for all queues can be consulted here
-
In case you cannot parallelize your job (split one single job into multiple parallel jobs) you can use job dependencies. In this case you create a chain of jobs on which N+1 jobs dependes on the previous one N. Check this link
NOTE There is a special queue available for very long jobs. This queue is restricted and available only in very special circunstances. If you have this type of requirement please contact the CNCA support helpdesk
UDocker Containers
Availability of udocker containers directly on CVMFS read-only filesystem in order to speedup their use and improve reproducibility, reliability and avoid interferences between calls, we will try to optimize compilations when ever possible. This containers can be used directly or run an user command throught a wrapper script.
The container technology is a conveniente way to provide stable software environments or to install them on situations where the configuration is complex or impossible. For example, the tensorflow framework is normally very hard to install on CentOS 7.x systems as found on our worknodes.
Available containers on CVMFS
| Environment | Target Arch. | Arch. Optimizations | Container SO | Applications |
|---|---|---|---|---|
| udoker/tensorflow/cpu/2.4.1 | Epyc_7552, Epyc_7501 | AVX AVX2 FMA | Ubuntu 18.04 | tensorflow-2.4.1 keras-2.43 pandas-1.1.5 madminer-0.8.0 numpy-1.19.5 scipy-1.5.4 |
| udocker/tensorflow/gpu/2.4.1 | Epyc_7552, NVidia_Tesla | AVX AVX2 FMA | Ubuntu 18.04 | CUDA-11.2 tensorflow-2.4.1 keras-2.43 pandas-1.1.5 madminer-0.8.0 numpy-1.19.5 scipy-1.5.4 |
How to use the udocker containers
The containers are meant to be run on workernodes, they will not work on the login servers, launch a batch job or start an interactive session. Note also that the gpu partition is the only one providing GPU devices.
Load environment
Load the appropriate environment, for exemple udocker/tensorflow/gpu/2.4.1:
$ module load udocker/tensorflow/gpu/2.4.1
This will configure the udocker environment and made available the wrapper u_wrapper used to start the container. When the container is started throught the wrapper the /tmp and the user working directory is imported into the container.
Execute a command
Now we can run any command using the wrapper, for example:
$ u_wrapper nvidia-smi -L
******************************************************************************
*                                                                            *
*               STARTING 2bcfad7b-1750-3fb8-9fb1-74acdf4e869e                *
*                                                                            *
******************************************************************************
executing: bash
GPU 0: Tesla T4 (UUID: GPU-8cce58c9-f3f7-839c-50f9-63e21f042152)
GPU 1: Tesla T4 (UUID: GPU-1f698e19-a902-2e73-0a54-44e02fa9c8ee)
Execute an interactive shell
We can run an interactive shell, as long we acquire and interactive allocation:
$ u_wrapper bash -i
 ******************************************************************************
 *                                                                            *
 *               STARTING 2bcfad7b-1750-3fb8-9fb1-74acdf4e869e                *
 *                                                                            *
 ******************************************************************************
 executing: bash

________                               _______________
___  __/__________________________________  ____/__  /________      __
__  /  _  _ \_  __ \_  ___/  __ \_  ___/_  /_   __  /_  __ \_ | /| / /
_  /   /  __/  / / /(__  )/ /_/ /  /   _  __/   _  / / /_/ /_ |/ |/ /
/_/    \___//_/ /_//____/ \____//_/    /_/      /_/  \____/____/|__/

You are running this container as user with ID 5800002 and group 5800000,
which should map to the ID and group for your user on the Docker host. Great!

tf-docker ~ >
Example of a complete job script
We will run a Deep Learning example.
Get the python script run.py and create a submit script as follow:
$ cat dl.sh
#!/bin/bash
#SBATCH -p gpu
#SBATCH --gres=gpu
#SBATCH --mem=45G
module load udocker/tensorflow/gpu/2.4.1
u_wrapper python run.py
Next, launch the script and wait for completion, once it start to run it should be very fast, about 10 seconds.
$ sbatch dl.sh
Submitted batch job 1435321

$ squeue
  JOBID PARTITION     NAME     USER ST  TIME  NODES NODELIST(REASON)
1435321       gpu    dl.sh username  R  0:01      1 hpc062

$ ls -l
-rwxr-----+ 1 username usergroup   409 May 25 21:06 dl.sh
-rw-r-----+ 1 username usergroup  1417 May 25 20:49 run.py
-rw-r-----+ 1 username usergroup 17034 May 25 21:06 slurm-1435321.out
The output file should be something like the file slurm-1435321.out.
Monitoring
Useful commands to monitor jobs or consumption
Resource Consuption
- The consuption can be monitored by a user by the report command.The command shows to two period current month + full consuntpion for each associated QOS. Users with more than one QOS will show separetely
[root@cirrus08 ~]$ report --user fabiananeves
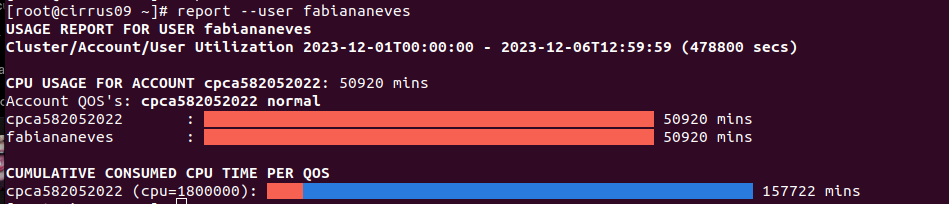
- On this example the user fabiananeves consumed 50920 mins of the cpca582052022 total consumed for the period 2023-12-01T00:00:00 - 2023-12-06T12:59:59.
- On the second line you have the total QOS consumed 157722 mins (red bar) and in brackets you have the QOS atributed (cpu=1800000). The blue bar show the difference bettween the total and the consumed.
Quality of Service (QOS)
Quality of Service (QoS) is used to limite the characteristics that a job can have.
Default QOS per partition
For every partition (fct, gpu, etc), there is a Quality of Service with different defined parameters like MaxJobs, MaxSubmitJobs. This parameters act on all the jobs submitted by all user's on that partition. To see the the default QOS for a specific partition run the below scontrol command:
fct partition
[jpina@cirrus02 ~]$ scontrol show partition fct
PartitionName=fct
   AllowGroups=ALL AllowAccounts=fct1,cpca27902020,cpca59032020,cpca3952082021,cpca3949842021,cpca4021052021,cpca3969692021,cpca097952021,cpca4076702021,biosim,cpca4209172021,cpca4081432021,cpca4011972021,dsaipa00832020,cpca098302021,cpca097822021,cpca097522021,cpca096232021,cpca097312021,cpca097642021,cpca230372022,cpca262792022,cpca158802022,cpca158802023,cpca56132020,cpca156102022,cpca158542022,cpca280462022,cpca096232021,cpca159122022 DenyQos=normal,low,medium,high
   AllocNodes=ALL Default=NO QoS=N/A
   DefaultTime=NONE DisableRootJobs=NO ExclusiveUser=NO GraceTime=0 Hidden=NO
   MaxNodes=UNLIMITED MaxTime=4-00:00:00 MinNodes=0 LLN=NO MaxCPUsPerNode=90
   Nodes=hpc06[0-3]
   PriorityJobFactor=1 PriorityTier=1 RootOnly=NO ReqResv=NO OverSubscribe=NO
   OverTimeLimit=NONE PreemptMode=OFF
   State=UP TotalCPUs=384 TotalNodes=4 SelectTypeParameters=NONE
   JobDefaults=(null)
   DefMemPerCPU=5000 MaxMemPerNode=UNLIMITED
gpu partition
[jpina@cirrus02 ~]$ scontrol show partition gpu
PartitionName=gpu
   AllowGroups=ALL AllowAccounts=aeon,biomeng,biosim,cbmr,ccmar,cedis,centec,cerberos,chlab,ciceco,ciimar,cncb,comics,cosmos,csys,dei,eeisel,eworm,dosimetry,fcneuro,fctunlrequinte,fculbioisi,fculce3c,fculdi,fculfisica,fculgfm,fculibeb,feno,hpc,ibb,ibet,ihmt,inl,inov,ipfn,insa,isctesociologia,ispa,istcftp,lapmet,lasige,lnec,lnecprd,localmaxs,mcfeup,neuro,nlx,nps,scipion,seatox,solarb,spac,t3atlas,t3cms,ua,uaberta,uait,uaquimica,ubim,uc,uccibit,uedi,ulcefisa,ulibeb,ulusofona,um,unlims,unlitqb,xtal,yeastgenomics,cpca27902020,cpca59032020,fct1,cpca4209172021,cpca262792022,cpca56132020,cpca158542022,cpca280462022,cpca097822021,cpca159122022 AllowQos=normal,gpu3952082021,gpu4021052021,gpu4209172021,gpu262792022,gpu158802022,gpu158002022,gpu158542022,gpu280462022,fct1,gpu159122022,gpu097822021
   AllocNodes=ALL Default=NO QoS=N/A
   DefaultTime=NONE DisableRootJobs=NO ExclusiveUser=NO GraceTime=0 Hidden=NO
   MaxNodes=1 MaxTime=4-00:00:00 MinNodes=0 LLN=NO MaxCPUsPerNode=2
   Nodes=hpc06[0-3]
   PriorityJobFactor=1000 PriorityTier=1000 RootOnly=NO ReqResv=NO OverSubscribe=NO
   OverTimeLimit=NONE PreemptMode=OFF
   State=UP TotalCPUs=384 TotalNodes=4 SelectTypeParameters=NONE
   JobDefaults=(null)
   DefMemPerCPU=5000 MaxMemPerNode=UNLIMITED
hpc partition
[jpina@cirrus02 ~]$ scontrol show partition hpc
PartitionName=hpc
   AllowGroups=ALL AllowAccounts=aeon,biomeng,biosim,cbmr,ccmar,cedis,centec,cerberos,chlab,ciceco,ciimar,cncb,comics,cosmos,csys,dei,dosimetry,eeisel,eworm,fcneuro,fctunlrequinte,fculbioisi,fculce3c,fculdi,fculfisica,fculgfm,fculibeb,feno,hpc,ibb,ibet,ihmt,inl,inov,ipfn,insa,isctesociologia,ispa,istcftp,lapmet,lasige,lnec,lnecprd,localmaxs,mcfeup,neuro,nlx,nps,scipion,seatox,solarb,spac,t3atlas,t3cms,ua,uaberta,uait,uaquimica,ubim,uc,uccibit,uedi,ulcefisa,ulibeb,ulusofona,um,unlims,unlitqb,xtal,yeastgenomics AllowQos=normal
   AllocNodes=ALL Default=YES QoS=N/A
   DefaultTime=NONE DisableRootJobs=NO ExclusiveUser=NO GraceTime=0 Hidden=NO
   MaxNodes=UNLIMITED MaxTime=4-00:00:00 MinNodes=0 LLN=NO MaxCPUsPerNode=UNLIMITED
   Nodes=hpc04[6-8]
   PriorityJobFactor=1 PriorityTier=1 RootOnly=NO ReqResv=NO OverSubscribe=NO
   OverTimeLimit=NONE PreemptMode=OFF
   State=UP TotalCPUs=192 TotalNodes=3 SelectTypeParameters=NONE
   JobDefaults=(null)
   DefMemPerCPU=8000 MaxMemPerNode=UNLIMITED
User QOS
By default there are no user QOS atributed. All user QOS atributed by the CNCA support team are unique to specific users. The following comand show how to check the QOS you belong to:
[martinsj@cirrus02 ~]$ sacctmgr show user fmartins withassoc -p
User|Def Acct|Admin|Cluster|Account|Partition|Share|Priority|MaxJobs|MaxNodes|MaxCPUs|MaxSubmit|MaxWall|MaxCPUMins|QOS|Def QOS|
fmartins|biosim|None|production|cpca097522021||1||||||||cpca097522021,gpu097522021,normal||
fmartins|biosim|None|production|cpca097822021||1||||||||cpca097822021,gpu097822021,normal||
fmartins|biosim|None|production|biosim||1||||||||cpca71402020,incdbiosim21,normal||